Natural ecosystems provide many benefits—services like clean drinking water, timber, and productive harvests. Each of these “ecosystem services” is the product of complex interactions among species, landscapes, and people. This complexity also means that ecosystem services can be difficult to measure and assess. Because their value is hard to quantify, ecosystem services may be ignored in decision-making and hidden from public awareness. The ABMI’s Ecosystem Services Assessment (ESA) project aims to change that.
As its core mandate, the ESA hopes to measure and understand the value of ecosystem services across Alberta. For example, we have developed simulation models and maps to explore the supply of specific ecosystem services and reveal how it might change given various land management activities. To date, the ESA has modeled and mapped five ecosystem services: water purification, forage production and carbon storage, timber production, forest carbon storage, pollination, and biodiversity. Now, we’re pleased to launch the Ecosystem Services Mapping Portal, making interactive data on ecosystem services accessible to Albertans.
This mapping tool lets users investigate the provision of a particular ecosystem service and determine how that service changes with different input variables. Users first select a region of Alberta and one of the ecosystem services for which they would like to see the supply. They can then run the model with default parameters, or move various sliders to set their own.
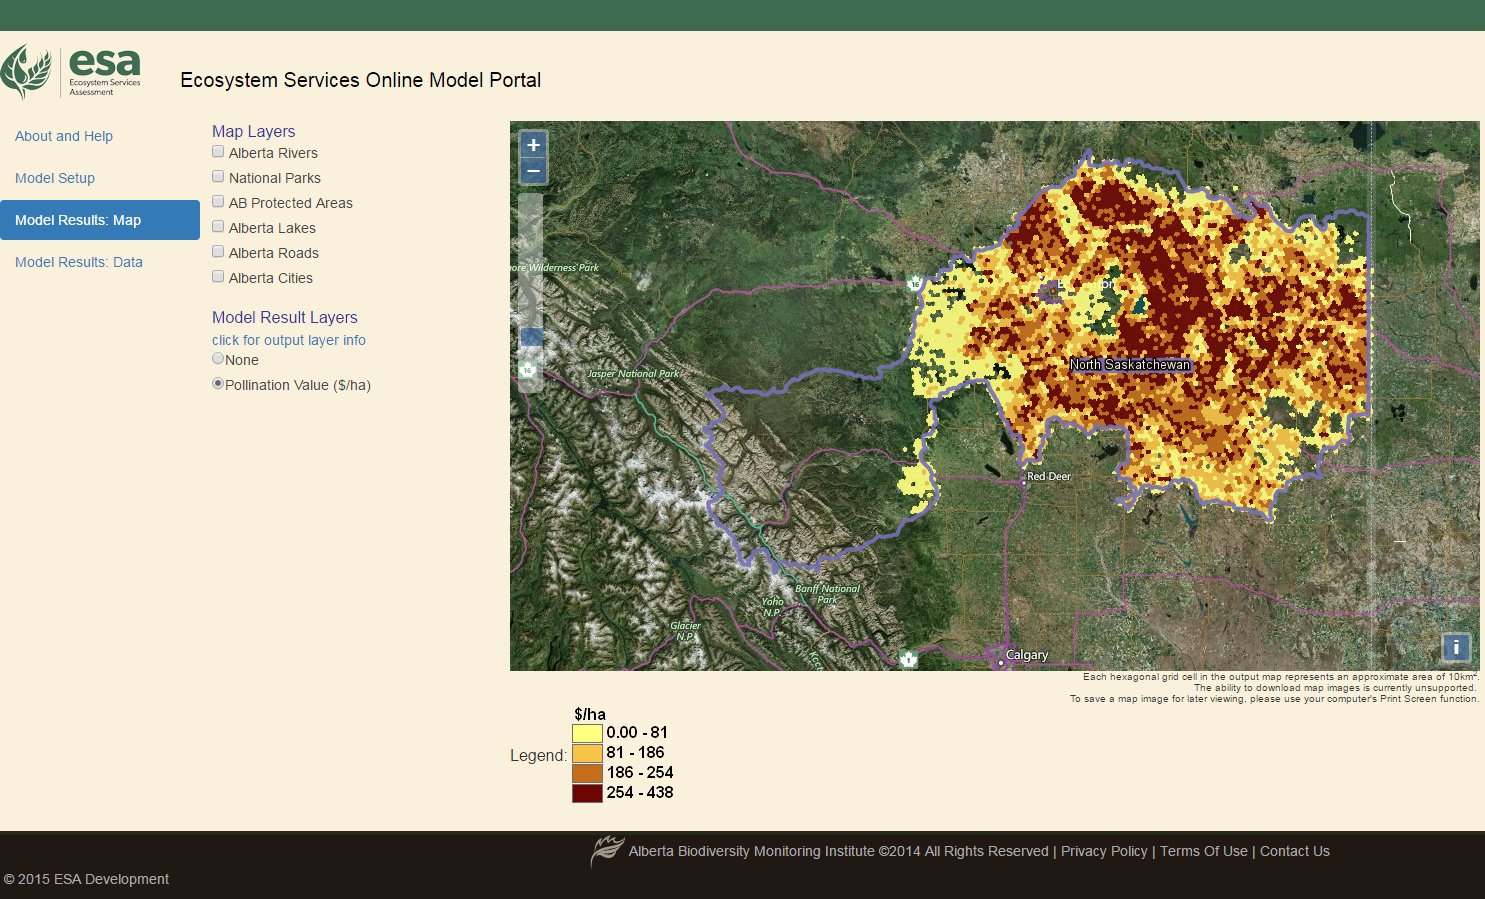
A screen grab of the Ecosystem Services Mapping Portal in action. This example shows the value of pollination services to canola production in the North Saskatchewan region.
For example, a user might be interested in how much of the canola produced in the North Saskatchewan planning region can be attributed to wild bees—and what the economic impact of that contribution is, based on the market price of canola. Select pollination as the ecosystem service, select the North Saskatchewan region, and input variables will appear. The default price of canola is based on the 2010 market price, but any value can be specified. Running the model produces an output map illustrating the total value of pollinators (in $/ha) to canola production in the North Saskatchewan region. This is what would be lost if these pollinators disappeared.
Users are also encouraged to analyze data according their specific needs. Clicking Model Results: Data allows users to download a GIS layer (raster) of the selected model as parameterized, and displays summary information. Raw data used in the model may also be downloaded as a CSV file. The mapping portal provides basic information about how each of the models works, with links to more detailed documentation. Or, contact us with any additional questions.
We hope to add new features to the ESA Mapping Portal over time, and encourage users to take a short survey to provide feedback. We hope that this new tool will help Albertans, whether land managers, stakeholders, or members of the public, explore and understand their province. Visit the mapping portal here to try it out!
Note: All assessments are completed over provincial and regional scales and use data available at those scales. Thus, the maps make most sense when viewed at the regional scale. However, the mapping portal does allow users to zoom in to a smaller region of interest if desired.