Tucked away in the basement of the Centennial Centre for Interdisciplinary Science at the University of Alberta is the ABMI’s Geospatial Centre and its team of Air Photo Interpreters. Kitted out in 3D glasses, they produce the most sophisticated and detailed land and vegetation cover data available for the province of Alberta. The data coming out of this office is important in terms of biodiversity monitoring–trend monitoring, in particular–for the province of Alberta.
“Our system here allows us to produce fine-grained 3D images for different regions of the province,” says Bryce Maynes, the lead of the ABMI’s Air Photo Interpretation group, as he swoops in to show me a lone cabin, built right on a river bank with its back to a wall of forest. “I don’t think many people know about this place,” he says. The level of detail of the images, combined with the nuance of the ABMI’s land cover classification system, means that almost nothing escapes Maynes and his team’s notice – and it means that they can assess changes in land cover over time at the most detailed scale in the province.
The ABMI monitors biodiversity and human footprint across the province of Alberta in part by conducting surveys at 1,656 sites–each spaced 20 km apart from the next–across the province. In addition to field-level information (species abundance and local footprint data), at each of these sites the ABMI also collects aerial photos of plots 3×7 kilometers in size. These 2D aerial photos are then overlapped and layered to create a 3D model of the land below. It’s the 3D models that are analyzed and classified into categories of topography, land use, and vegetation by the team of Air Photo Interpreters, including Maynes and his colleagues Mark Bablitz, Elvis Pineda, and Victor Tran.
Once the analysis and classification is complete, the team converts the 3D model into a GIS inventory layer at a fine scale (1:1,500, though the Interpreters can zoom in for more detail when necessary). This resultant detailed land and vegetation cover information is poised to become the highest standard in Alberta for assessing trends and change in land cover and habitat across the province. The air photo work complements the ABMI’s Human Footprint products, also created by the ABMI’s Geospatial Centre but using satellite imagery: the Wall-to-Wall province wide Human Footprint GIS layer (scale 1:15,000), that is updated every two years, and an annually updated Human Footprint layer (scale 1:5,000) that queries land cover changes at all of the ABMI’s 1,656 sites at a coarser scale than the Air Photo Interpreters do. In this way, the team’s work can also be used to verify the ABMI’s Human Footprint results.
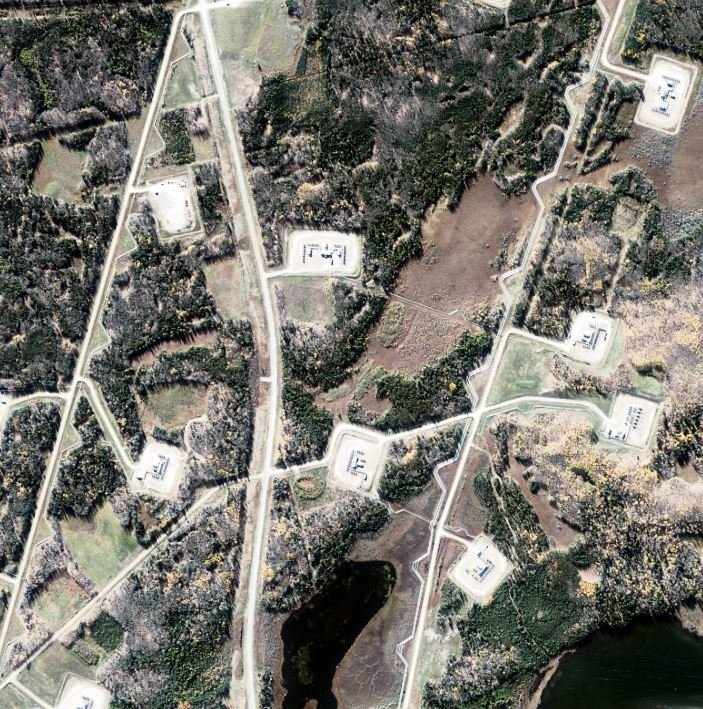
Aerial photo of well pads, before interpretation.
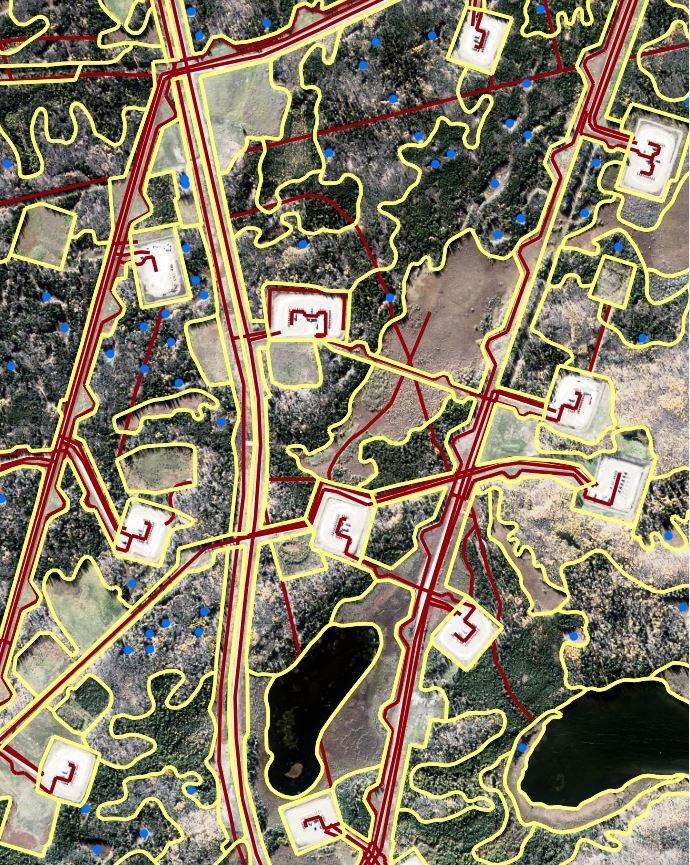
Interpreters have begun to delineate polygons, identifying particular features.
Because of how detailed their analysis is, the Air Photo Interpreter team works through about 120-140 of the ABMI’s 1,656 3×7 km sample plots per year – it’s painstaking work! When the ABMI interprets land cover data, it requires taking images and attempting to identify all of the features present from pasture to forest and from well pad to shopping mall. The ABMI’s 3×7 km land and vegetation cover interpretation is particularly powerful because of the fine-grained measure of the area as well as the nuance and detail of the classifications. For each category, the ABMI uses more levels of classification than anyone else in the province. Maynes and his team of three begin their interpretation and digitization of land feature types by separating wetland from upland. Most land cover inventories stop there, however, the ABMI goes further and categorizes wetlands into four land cover types for the Green Zone (Fens, Swamps, Bogs, and Marshes) and eight land cover types[1] for the White Zone.[2] Wetlands and other land features found in the Green Zone often exist on a longer timeframe than do similar White Zone features where, for example, a wetland may exist only seasonally. For that reason, the ABMI then characterizes the four Green Zone wetland land cover types into 20 subtypes based on landform, vegetation and other features, in order to be sure to capture the nature of the wetlands found in that zone.
Similarly sensitive scales are used to measure and classify a range of categories such as vegetative and non-vegetative land cover, moisture regime, and management status. The ABMI designates areas in relation to their land use, in order to provide additional information on, for example, the status of a farmyard, whether it is abandoned or in operation, or how a particular feature is regenerating over time. Management status is generally categorized as: In Operation, Abandoned, Natural Unmanaged, Under Construction, Artificial Regeneration, and Natural Regeneration. These designations can be used to verify the ABMI’s Human Footprint calculations and inform our analysis by providing a more complete picture of what’s occurring in a specific spot at a specific time.
This detailed classification by Maynes and the rest of the team provides the best information possible about topography, land use and vegetation in the province – right down to microhabitats. “You find little pockets of wetland in upland areas. For example, undulations on a ridge will collect water. It’s important to know about that wetland pocket if, for example, you were doing research on amphibians or certain aquatic plants.”
The team of Photo Interpreters relies upon years of experience in the forest industry to assess and classify the images. “The different tones and textures in the images tell you what’s there. Deciduous trees have a certain texture and conifers are very conical,” explains Maynes. Classifying these subtle distinctions in the topography and vegetation also gives us information about which animal species are likely to be present in any given area of the province.

An aerial photo of a site near Fort McMurray, before interpretation.
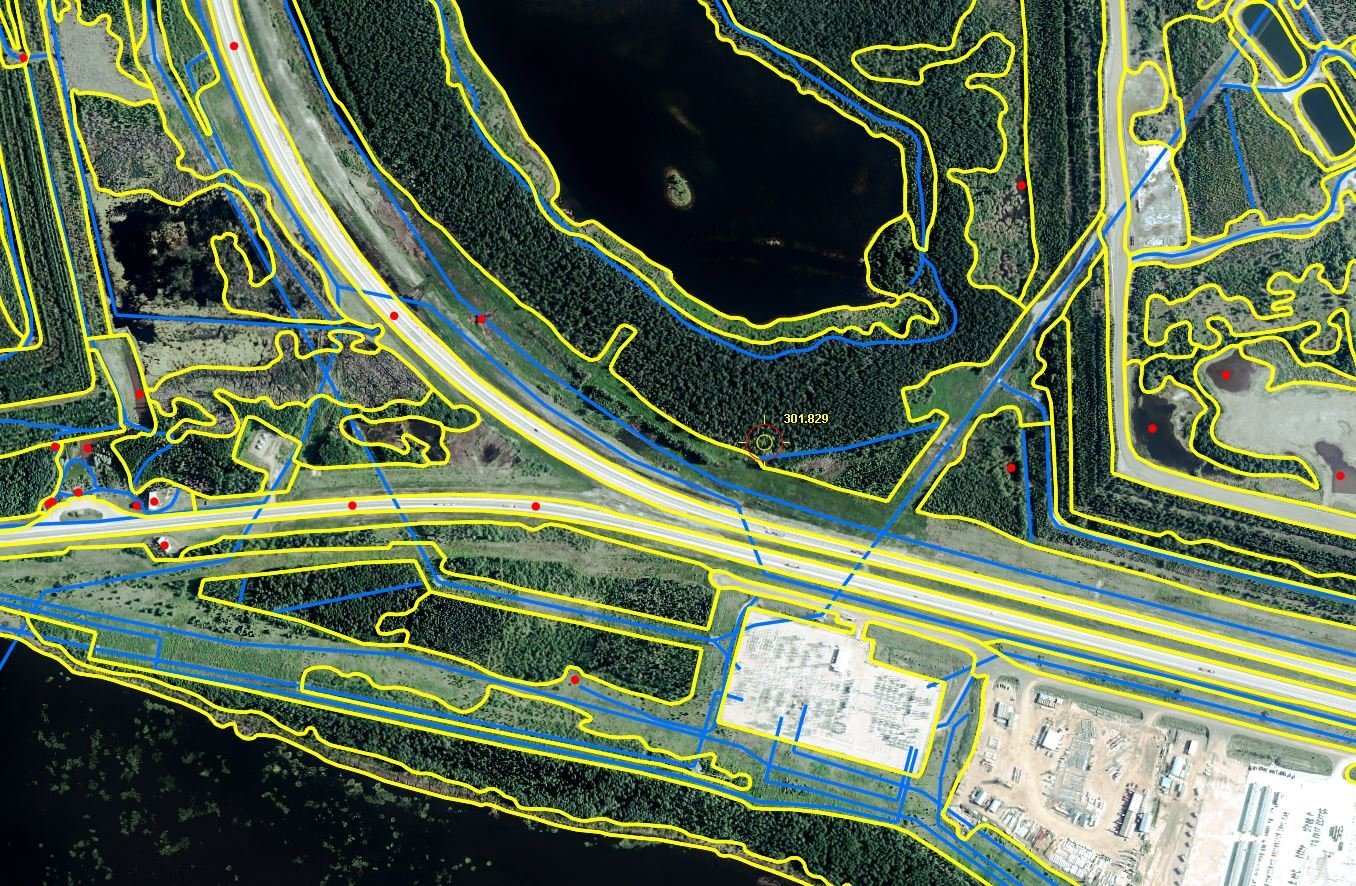
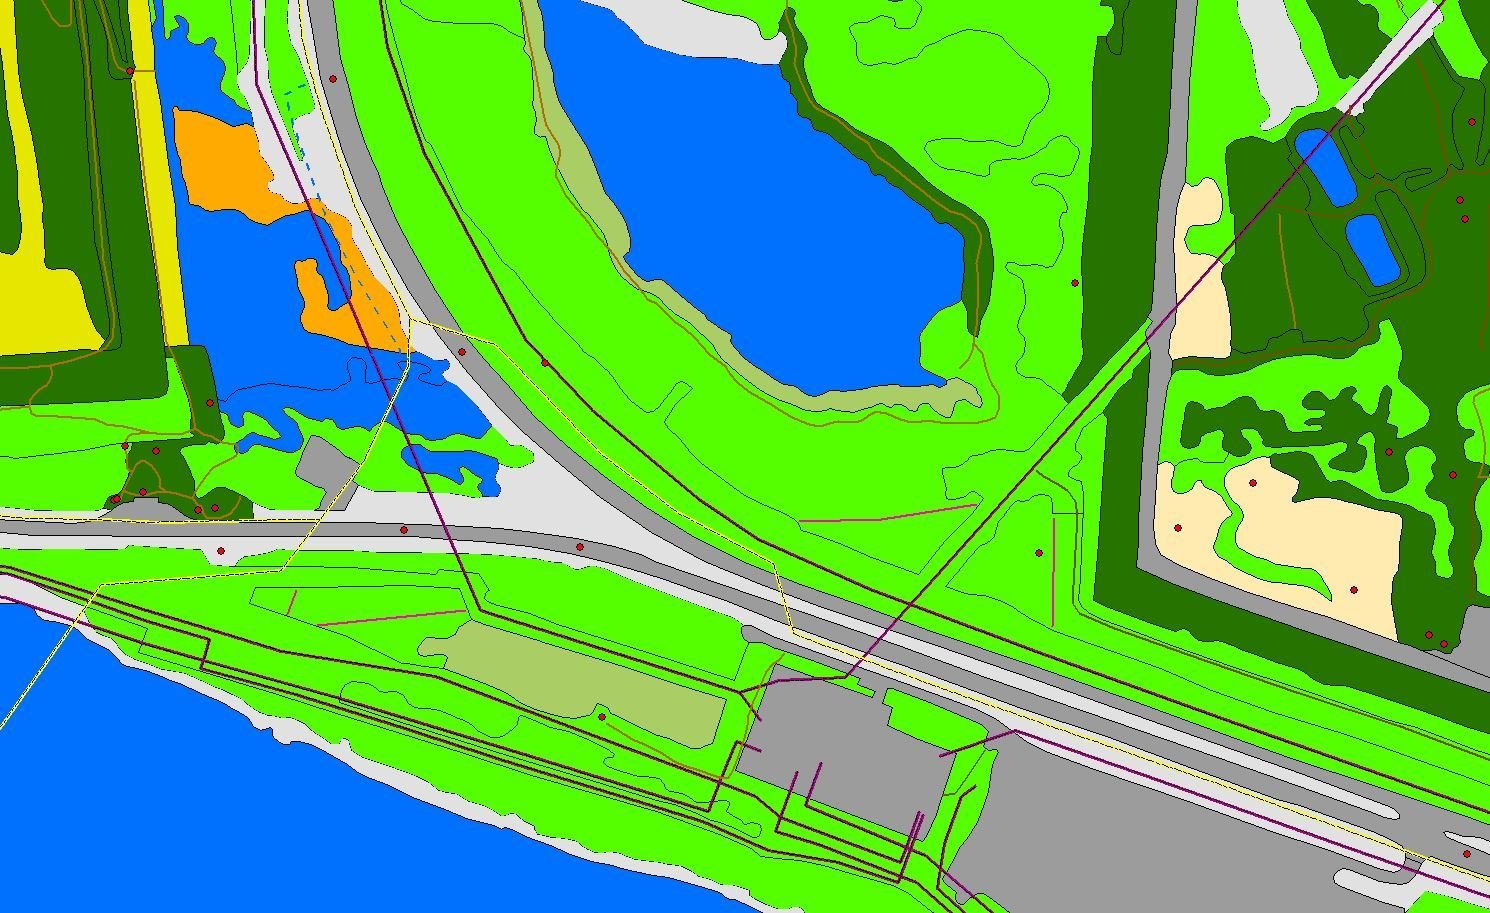
The same site, with polygons delineated. The cover image is this same site, now as a digital representation of the aerial photo.
The detail and nuance of the classifications open up different possibilities for biodiversity management in the province, in part because it provides such accurate information at such a fine scale about how land cover features are changing over time. Equipped with information about not only topography and vegetation, but also specific wetland classifications and land use, and how each of these are changing over time, allows for better-informed decisions about how to manage biodiversity.
“Maps are limitless,” says Maynes. “They’re a key – it’s up to you what door you want to use them to open.” For example, under the Biodiversity Management Framework (BMF) the ABMI’s 3×7 photo-plot land cover information was used to validate and verify outcomes for biodiversity indicators in Lower Athabasca Planning Region.
Emanating from that office, where the team painstakingly combs through air photos with 3D glasses, searching for the smallest change in land cover, the ABMI’s 3D images and land cover analysis provide a resource for all stakeholders: visual indications of biodiversity status and trend that can inform how the province’s resources are managed for the future of all Albertans.
Written by Robyn Braun; edited by Lindsay Monk
Photos supplied by Bryce Maynes.
[1] These are: Marsh Open Temporary Graminoid; Marsh Open Seasonal Graminoid; Marsh Open Semi Permanent Graminoid; Marsh Open Alkaline Graminoid; Swamp Open Temporary Shrub; Swamp Open Seasonal Shrub; Swamp Open Semi Permanent Shrub; and Swamp Treed No permafrost No Internal Lawns.
[2] Alberta’s Green Zone is the forested area in the province. The White Zone is agricultural area.