Content for this post, by Evan DeLancey and Kurt Illerbrun, is adapted from an ABMI feature that recently appeared in the Alberta Society of Professional Biologists’ newsletter, BIOS. If you’re interested in learning more about ALPHA, the ABMI will be presenting a webinar on the topic on February 28—register for free here.
One of the neat things about working in environmental monitoring is the sheer range of tools available to use, and the rate at which they’re evolving. One example that’s rapidly changing monitoring science is the technology around remote environmental sensing—things like detailed satellite imagery of the planet.
The expanding array of Earth observation (EO) data is a goldmine of information. But it’s also a challenge: how do you integrate so much info from so many new and different sources into something cohesive and useful? Over the past year, the ABMI’s Geospatial Centre has been working on this in developing its new Advanced Landcover Prediction and Habitat Assessment (ALPHA) program.
With ALPHA, we’ve tried to approach a range of questions of interest to our data users by integrating input data from three distinct categories: static, real-time, and historical (Figure 1; if you’re a data nerd like us, the specific input data we currently use are listed at the end of the post). Using these input data sets, we can get new info for all of Alberta every 3–4 days and can even look back in time to monitor historical landcover trends.
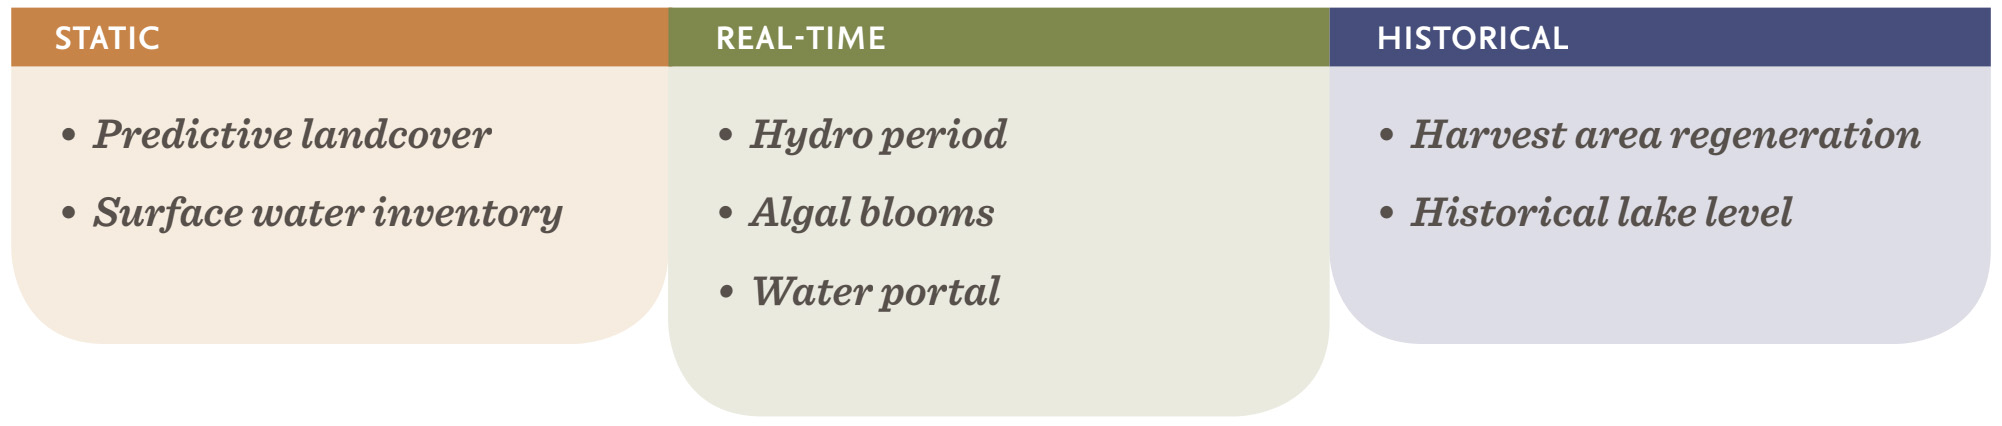
Figure 1: The three categories of the ALPHA Program. Operational/semi-operational products generated so far are listed under each category.
This approach gives easier access to large-scale (provincial to national and even global) data, and it offers uniquely consistent, seamless, repeated data collection for basically any study area (even daily revisits in some cases). And it’s especially useful for remote areas such as northern Alberta, since consistent field data collection and acquisition of airborne photography can be challenging. The different input data types naturally give rise to different output data products, which can be used to ask and answer questions like: Where are all of the wetlands in Alberta? How often does this particular prairie pothole flood? What year was this harvest area cut?
Like all ABMI data, data sets resulting from the ALPHA project are available for free from our website. We’ve included URLs for each, in case you want to check them out—just copy and paste into your browser. We’ve also developed a short case study using ALPHA data sets and methods to explore a disturbed wetland/fen complex in northern Alberta.

Figure 2: Predictive Landcover 1.0 for northern Alberta. 60% of the area is predicted to be upland followed by mineral wetlands, fen, bog, and open water (18%, 12%, 5%, and 4%, respectively).
Static data
One product we’re working on in the ALPHA program is the Predictive Landcover 1.0 data set (Figure 2), which uses machine learning to predict landcover across Alberta. As of January 2019, this integrated data set covers five landcover classes across 60% of Alberta (open water, upland, mineral wetlands, fens, and bogs; separate data sets are also available for several of these landcover classes). The ALPHA program also provides a surface water inventory for 60% of Alberta (as of January 2019) with info on the spatial extent of open water along with depth, volume, and permanence information. Over time, we hope to expand the coverage of these data sets to all of Alberta and other parts of Canada.
Real-time data
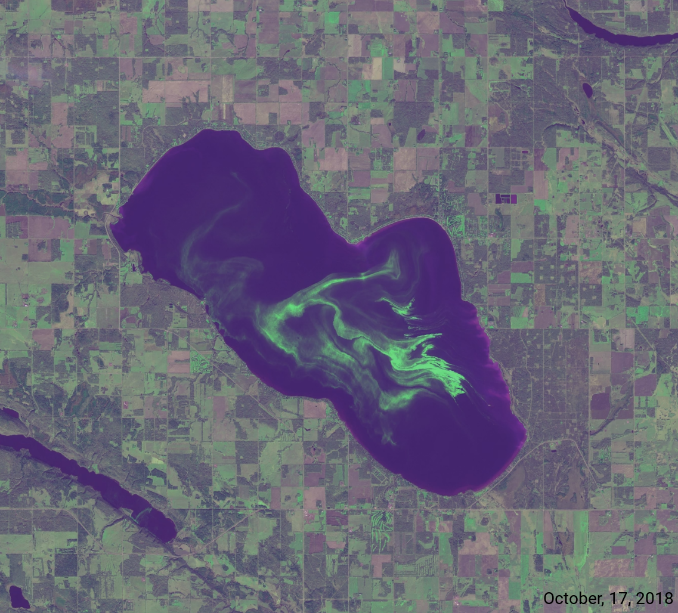
In the current version of ALPHA, we’re using real-time data mostly to monitor surface water, which displays dynamic seasonal cycles. The resulting Hydro Temporal Variability data set tries to capture seasonal surface water cycles by measuring the extent of surface water each week and then combining the results into a layer that summarizes both ephemeral wetland hydroperiod and the fluctuation of permanent water bodies (Figure 3). Now, in addition to the real-time spatial extent of water, the ALPHA Program is also attempting to monitor near-real-time water attributes like algal blooms and water quality (see banner image above). Stay tuned for more on that.
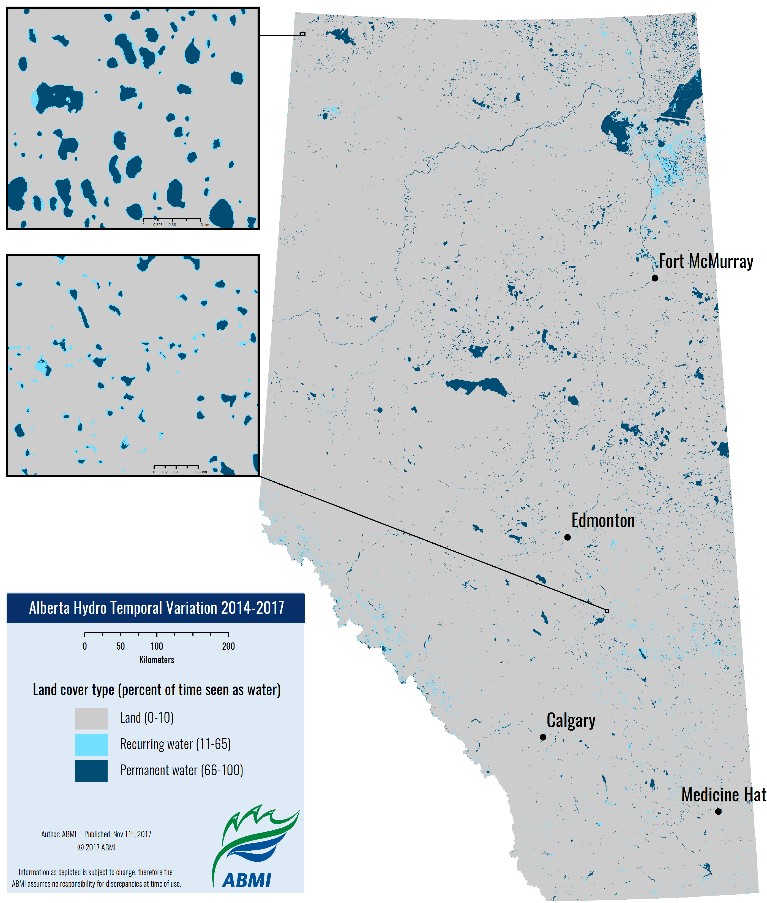
Figure 3: Hydro Temporal Variability for all of Alberta summarized into three classes—permanent water, recurring water, and land.
Historical data
ALPHA uses the Landsat historical archive, which spans 1984 to the present, to monitor long-term changes to the landscape. We’re using this info to assess the regeneration of human footprint features like harvest areas and well pads and to monitor historical surface water loss and correlate it to climate and land-use change. We plan to host these products as interactive web applications—again, stay tuned.
Looking ahead
The Predictive Landcover 1.0 data set is already being used to support the Government of Alberta’s Biodiversity Management Frameworks, and we hope that other ALPHA products will prove similarly useful. With ALPHA’s three data ‘themes’, our goal is to give a holistic view of the status and trends of Alberta’s—and Canada’s—landscapes. Going forward, we see the program providing Alberta-wide data sets and web tools, static snapshot maps, and near-real-time updates and historical info about pretty much any landcover feature of interest, all for free on the ABMI website.
There’s obviously a lot more to be done, but we’re lucky to be operating in a time when the underlying technology is evolving as fast as it is, and answers seem nearly as abundant as questions. As we continue to refine it, we hope ALPHA will help answer new questions and reveal novel ways of seeing, and understanding, our province.
Technical stuff: ALPHA draws on a lot of different open-access EO data sources, including but not limited to Sentinel-1 and -2 data from the Copernicus Programme; Landsat -5, -8, and SRTM data from the USGS; and ALOS from JAXA. To easily access these data, ALPHA uses Google Earth Engine (GEE). GEE stores multi-petabyte satellite data streams and allows them to be easily accessed and processed using a simple internet-accessible Application Programming Interface (API). To complement open-access EO data, ALPHA uses Light Detection and Ranging (LiDAR) data provided by the Government of Alberta to get high quality information about Alberta’s topography. Over time, we anticipate new data sources being integrated as they become available, allowing even more questions to be asked and, hopefully, answered.