
The ABMI is fortunate to have a regular column in the Alberta Society of Professional Biologists’ Quarterly newsletter, BIOS. The following post is adapted from a piece that appeared in the newsletter’s summer issue.
“Now, here, you see, it takes all the running you can do, to keep in the same place.”
When he wrote Through the Looking Glass, Lewis Carroll probably didn’t imagine that, a hundred years later, these words would find new meaning in biology. Spoken by the Red Queen of Looking-glass Land about a race in which the runners hustled mightily but barely moved, they were re-purposed in the so-called Red Queen hypothesis: the idea that, faced with an ever-changing environment and competitors that are always evolving, organisms must constantly adapt and evolve to succeed.
Running a large-scale biodiversity monitoring program sometimes feels like a trip to Looking-glass Land. At the ABMI, we constantly refine and improve the monitoring science; do our best to keep on top of emerging technologies; work with partners and stakeholders to ensure our work is relevant, timely, and useful; and do all of this as social, environmental, and political priorities evolve. Just like the Red Queen’s race, staying relevant means constantly seeking ways to improve.
Fortunately, the Red Queen also offers a path forward: “If you want to get somewhere else”, she says, “you must run at least twice as fast as that!” Which is why we’re trying out something new at the ABMI—think of it like one of those “Choose Your Own Adventure” stories, except, we hope, with only good endings.
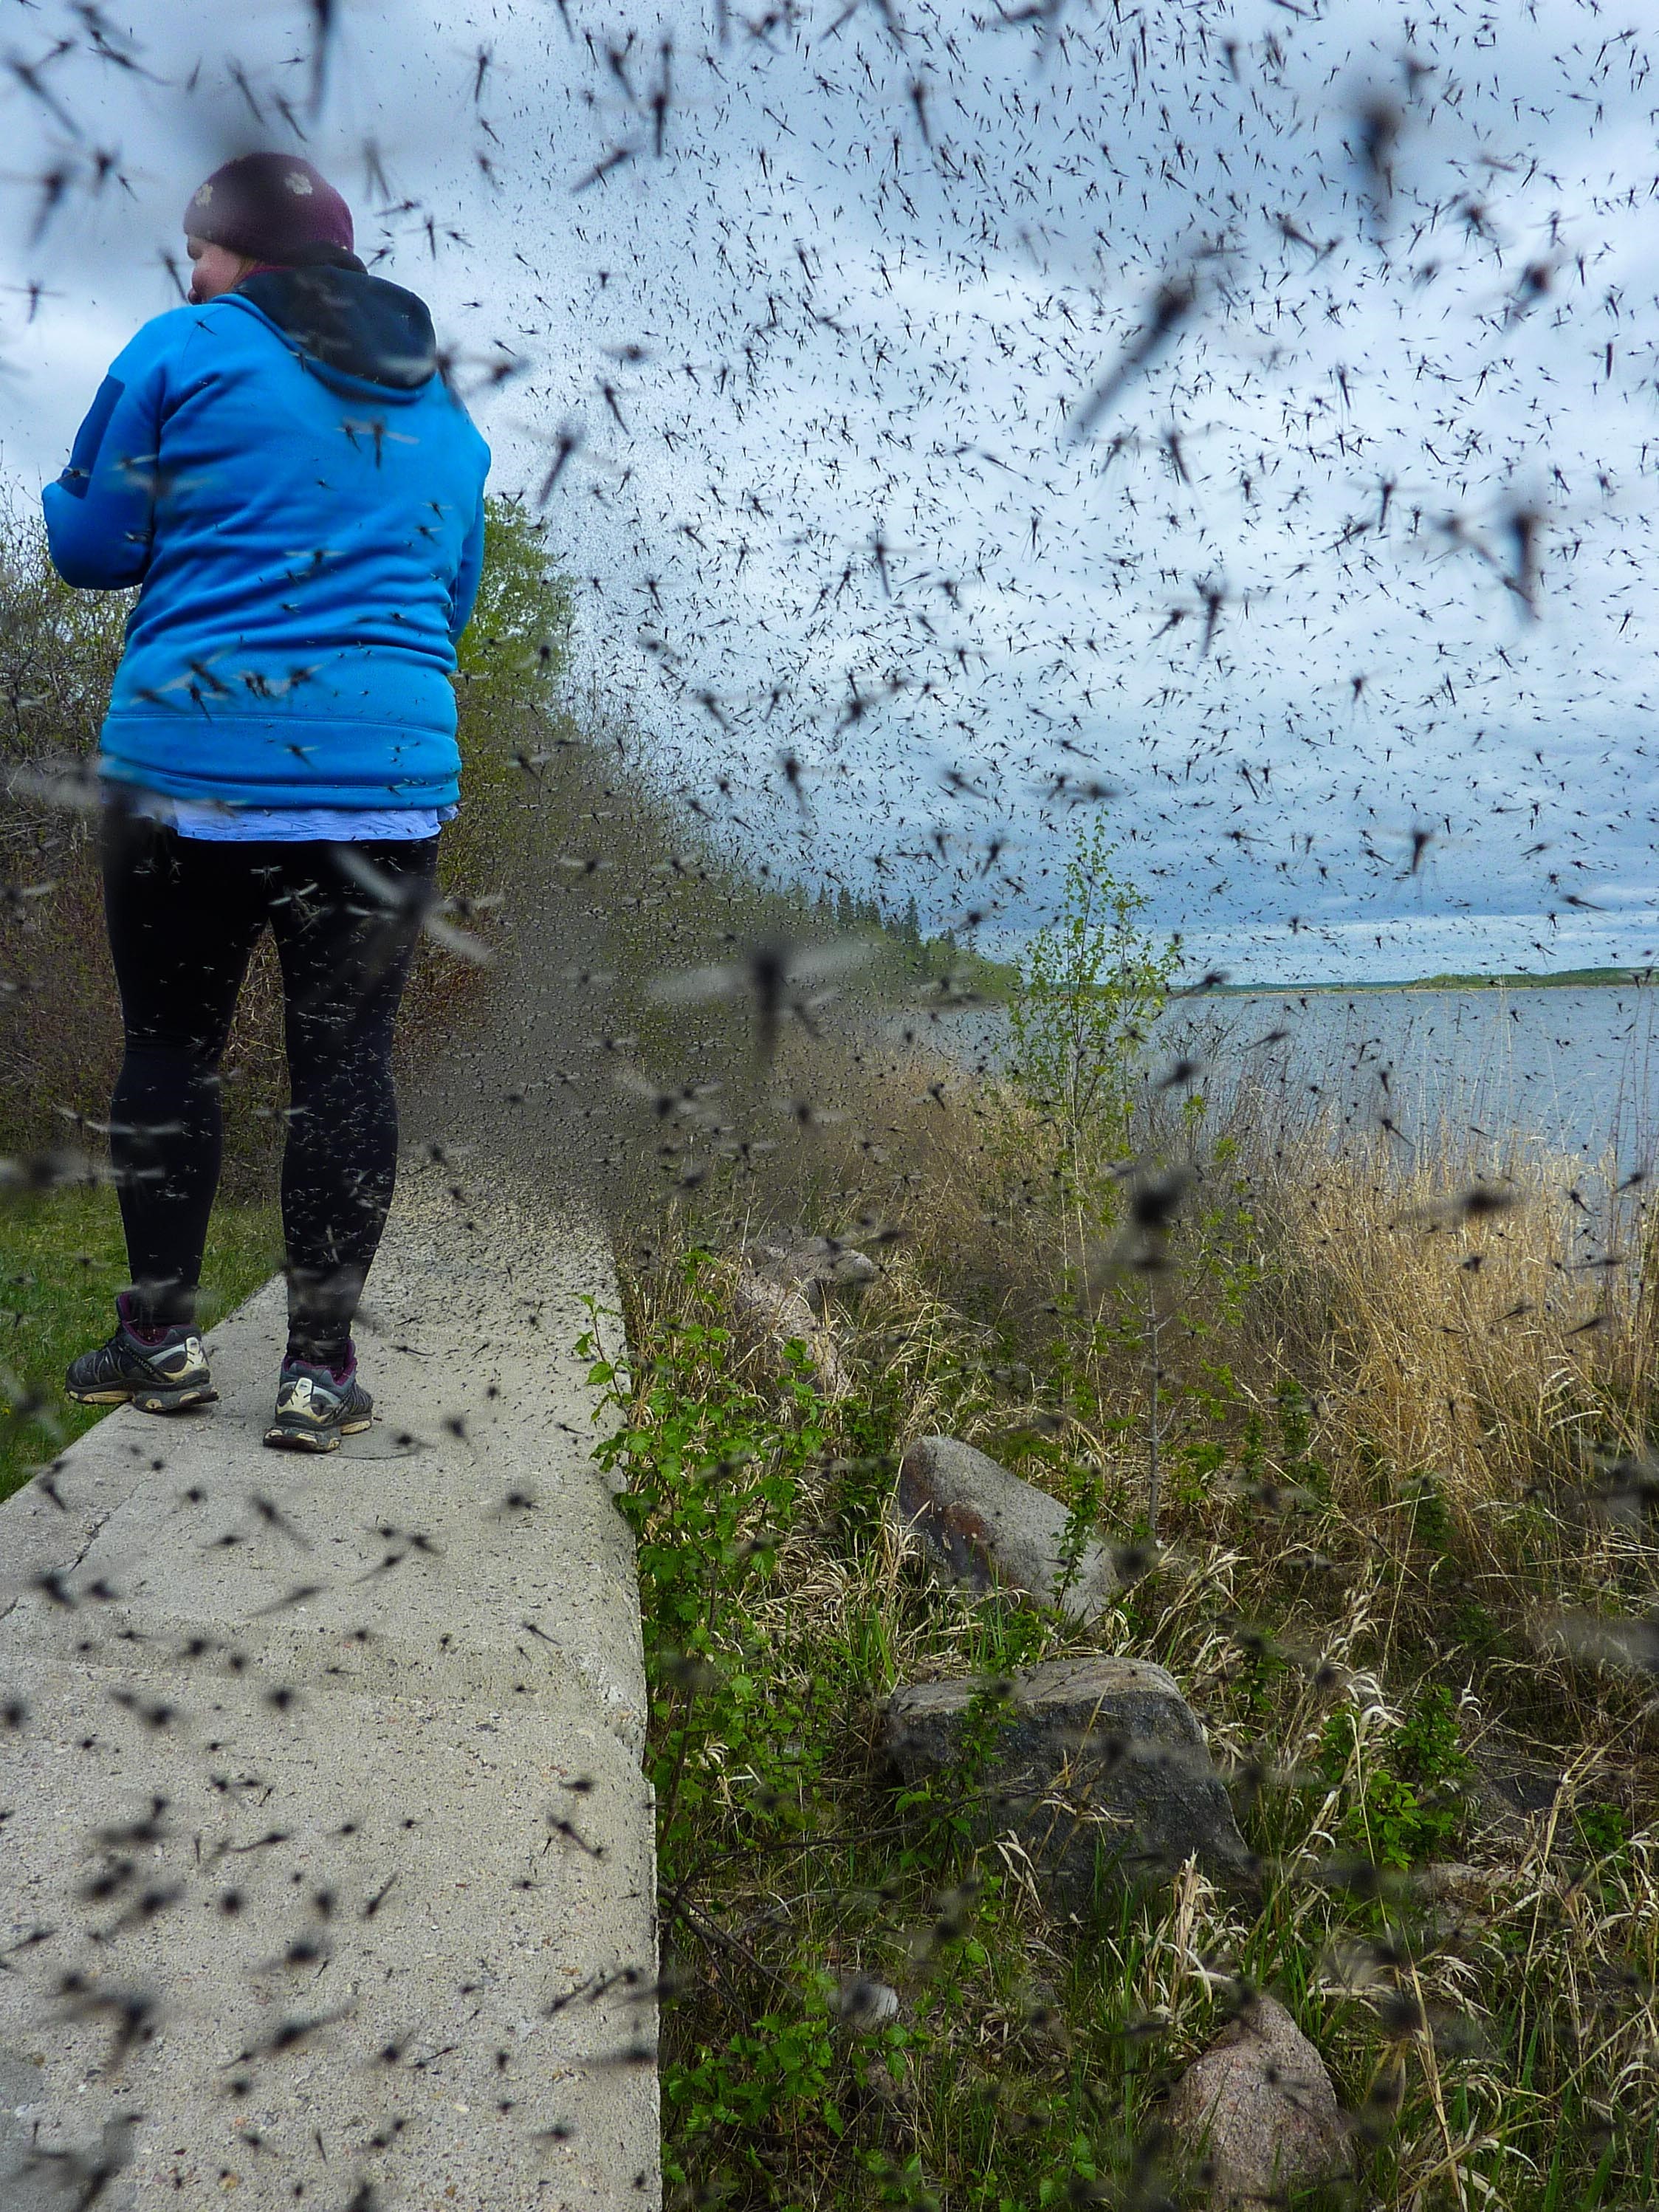
Data requests aren’t quite as numerous as these mayflies in Sir Winston Churchill Park, but they’re getting there. Credit: Kim House.
Keeping up with data requests is a constant challenge. The ABMI collects information on thousands of species and releases reports and updates for various regions and taxonomic groups, but many of our data users need even more detail for their work. For example, they might want to know about the status of a certain group of species across a self-defined area of interest. To empower our data users to find the answers they need to their specific questions, we’ve made an open-source custom reporting tool for species intactness and the effects of specific sectors on biodiversity. We’ve even given it a snappy name: since it provides CUstom REporting FOR INtactness and SECTor effects, it’s called cure4insect.
Developed by ABMI Statistical Ecologist Péter Sólymos—you might know him as part of the team behind the Vegan package for R—cure4insect is an open-source R package that can be used and customized by anyone. As Sólymos says, the motivation behind cure4insect was the desire to serve data users more effectively. “We wanted to better manage requests for intactness and sector effects summaries for arbitrary geographical units”, he says, “and also allow people to do it on their own without requiring direct staff support.” This is especially important for those wanting to make predictions based on proprietary data, or for anyone seeking to replicate or double check the ABMI’s results and understand how they’re achieved.
cure4insect is a decision support tool that draws on estimate and prediction data created by the ABMI in collaboration with the Boreal Avian Modelling (BAM) project. Currently, these data include Intactness (an estimate of how much a species’ relative abundance has deviated from the level expected in the absence of human influence; deviation in either direction means lower intactness) and sector effects (the contribution of a given sector, such as agriculture or urban development, to changes in species’ relative abundance). The package can also be used to work with customized landscape scenarios in a planning context; for example, you can use human footprint from any year the ABMI has available, or specify your own.

Species richness and intactness over a user-defined region of Alberta. The cure4insect package lets users specify any region for which the ABMI has data.
We hope you’ll give cure4insect a try. Right out of the box, you can produce your own customized reports like this, including spatial visualizations of your data, like this. You’ll have more nuanced customization options if you’re familiar with R, but if not, we’ve still got you covered: Sólymos has also developed a web application that provides much of the functionality. If you upload a CSV file with spatial unit IDs to define your area of interest and then select a taxonomic group, cure4insect will do the rest, and even email you a summary. You can provide feedback or suggest ideas about new functionality on the project website, and we expect the tool to evolve over time.
More generally, cure4insect represents a natural move for the ABMI toward greater transparency and accountability to our users—one of many things we heard during our recent 10-year Review process. “The particular open-source license we have chosen [for cure4insect] clarifies copyright and is also a ‘business friendly’ MIT license”, says Sólymos. This is to ensure that both public and private users can use the tool effectively. Ultimately, as Sólymos says, “We want broader use of our info products, and this package facilitates that.”
cure4insect is already in use by the Government of Alberta as part of land-use planning processes, but we hope it will help many others in their work. And we also see it as a harbinger of things to come: Over the next few months, we’ll be rolling out a new, interactive version of our Mapping Portal, which will let users upload and visualize their own data layers, and we’ll be adding to the functions provided by cure4insect as part of a new Biodiversity Data Query Tool.
Open-access, customizable tools are one way we’re trying to move forward in the Red Queen’s race to ensure credible biodiversity data are available to those in need. As requests for data increase, we’re always looking for ways to satisfy them more efficiently—a challenge we’re happy to have, since it means our data are being actively used. At the same time, while we’ll keep making reports and other information products that give insights into the state of Alberta’s biodiversity, we understand that our users are the best judges of what they need.
Seen another way, the Red Queen’s race can also serve as a metaphor for environmental stewardship in general. We, along with land-users, -planners, and -managers, are all ‘runners’, working to understand, manage, and ensure the vibrancy of Alberta’s living resources. We hope that by sharing open-access tools like cure4insect, we can do our part to help everyone get a little further ahead.