A new collaborative paper looks at different approaches to estimating population size for birds, and what they mean for how we understand population changes over time. In this guest post, the paper’s lead author and ABMI senior statistical ecologist Péter Sólymos gives us a behind-the-scenes tour.
Recently, I worked with a team of researchers from the ABMI, Boreal Avian Modelling (BAM) project, Canadian Wildlife Service (Environment and Climate Change Canada), and United States Geological Survey, to develop improved, spatially explicit models—essentially, models that relate populations to an actual map of landscape variables—for 81 land bird species in northern Alberta. We compared these new “pixel-based” estimates of bird abundance to a commonly-used but non-spatially explicit estimate (Partners in Flight (PIF)) that’s based on the North American Breeding Bird Survey (BBS) data set.
Our results were recently published in the journal Condor. In short, we found issues related to using roadside bird surveys (as in the PIF approach) for estimating populations in areas with few roads, such as in Northern Alberta and much of boreal North America. The variation between the PIF and “pixel-based” estimates was large enough to change the population ranking of the species we examined. One potential implication of our results is that some historical bird populations may be underestimated. If so, that would mean that some estimates of population declines, which compare today’s populations to those from the past, may also be underestimated. Our results are summarized in more detail in a separate blog post, here. In this post, however, I’d like to give a behind-the-scenes tour of the “made in Alberta” models that served as the basis for the paper and their relevance for provincial resource management.
The models we used in the paper are the same models that are presented on the ABMI’s biodiversity browser and mapping portal. The only difference is that we used a subset of survey years to match the years of the BBS data used for the PIF estimates, to allow direct comparison. So how did these models allow us to make the robust spatial predictions presented in our paper?
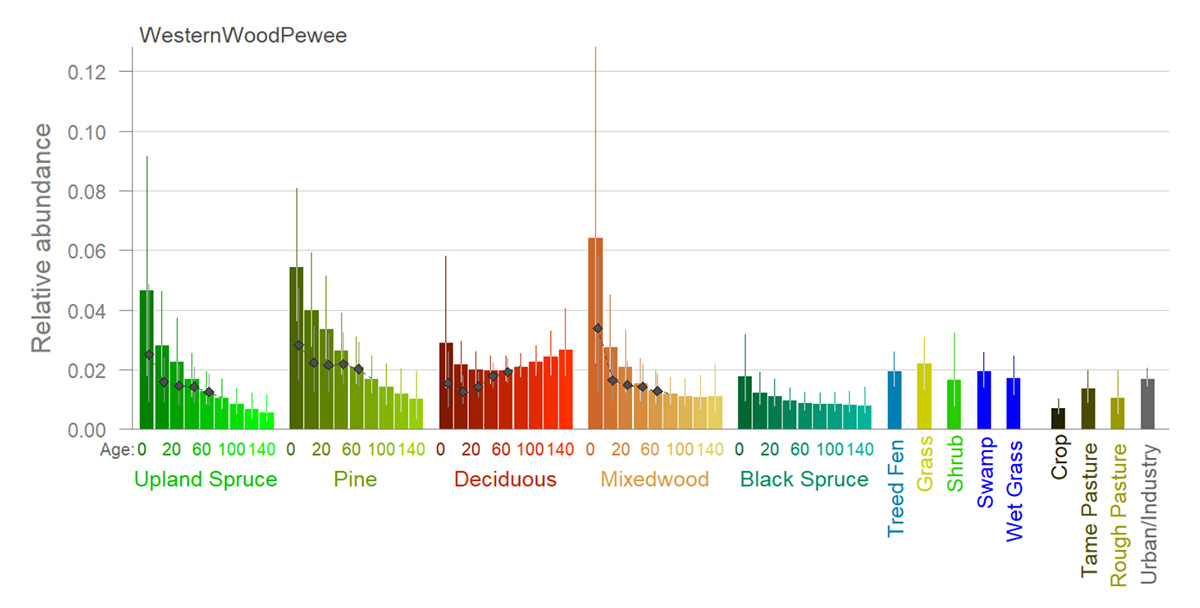
Predicted relative abundance of Wood Pewee (bars) as a function of vegetation and human footprint type. Dots are added to forest types where harvesting occurs and show the predicted species abundance in cutblocks of various ages. Vertical lines represent 90% confidence intervals.
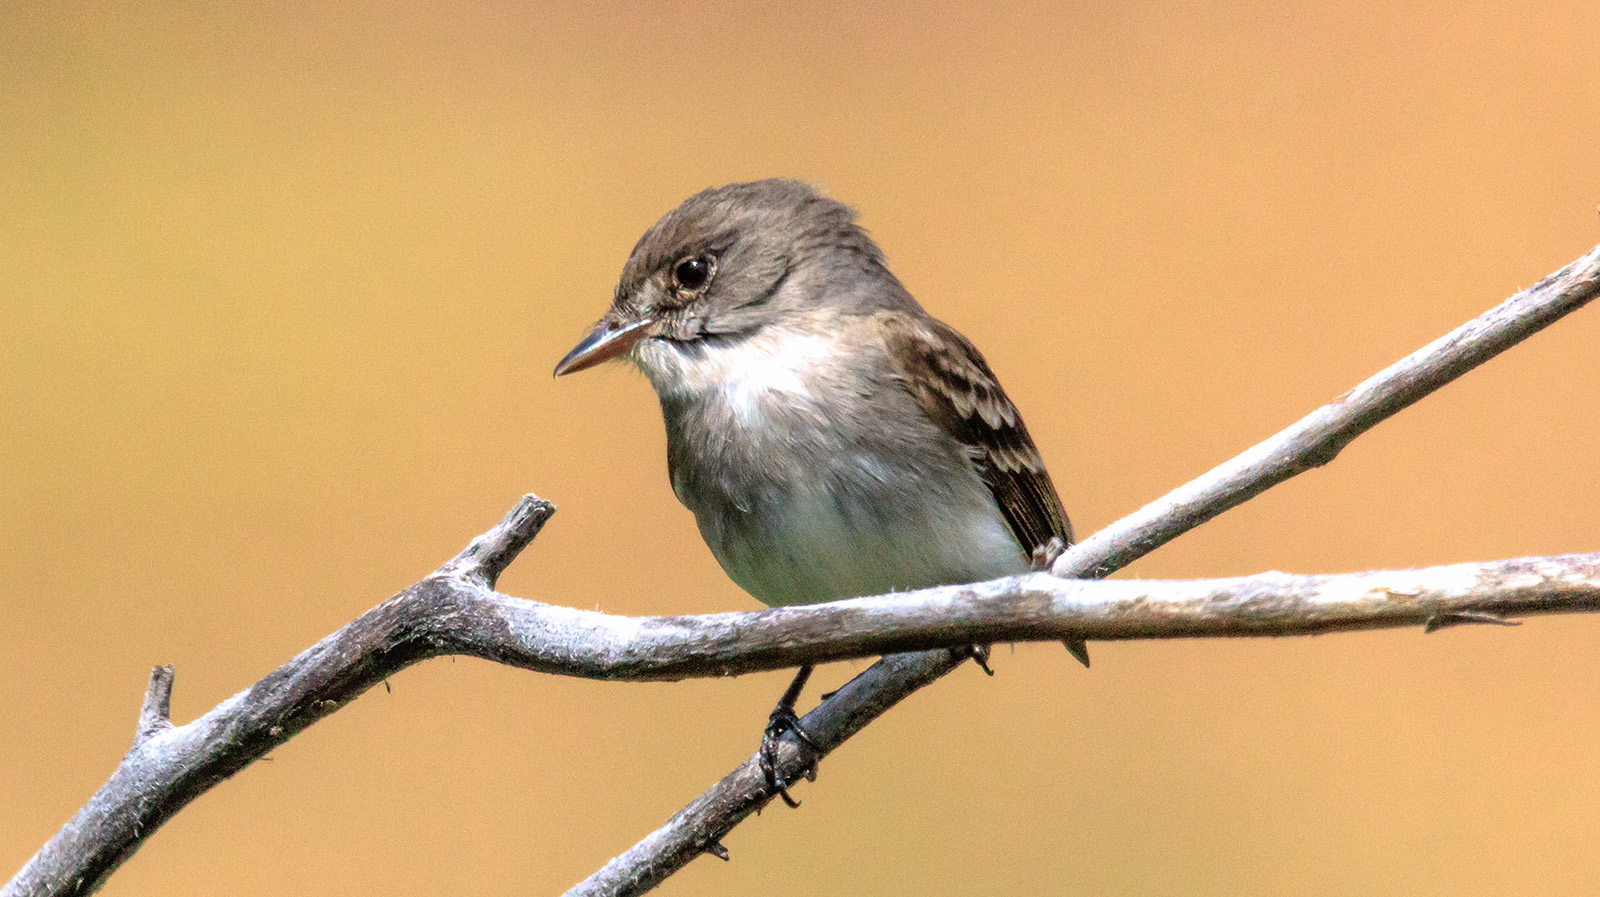
First of all, we were able to distinguish 74 different vegetation types, stand types and age categories, and various types of human footprint. The average density estimates within these land cover types are best visualized in habitat association graphs for each species; I’ve included an example here and below for Western Wood Pewee, a migratory aerial insectivorous species with special affection for forest clearings. These estimates show how abundance, or, more precisely, habitat for the species, is expected to change as a function of the forest stand types and ages in a given region. If, for example, the stand/age distribution in the region is changing as a result of fire or forest harvest, we would expect more suitable habitat for the species. If, however, climate change effects result in more deciduous forest in the future at the expense of coniferous and mixedwood stands, abundance would be expected to decrease over time.
The second part of our models accounted for spatial variation in bird abundance apart from the land-cover-related variability. We used spatial and climate variables to capture this spatial component. Together, these components gave us spatial abundance estimates for each species at a 1 km^2 resolution. We estimated population sizes for the bird species by adding up the 1 km^2 level predictions. These predictions (based on all the years of bird data) are available for download from the ABMI mapping portal or via a software tool. These layers provide information about spatial distribution and population sizes of species province-wide or inside target study areas.
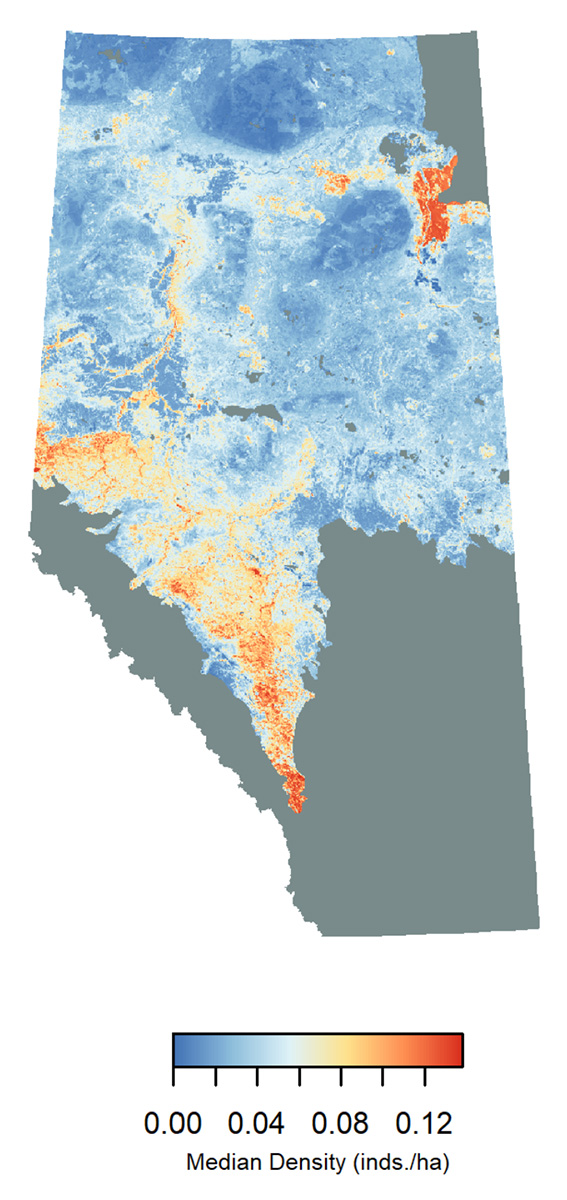
Predicted relative abundance of the Western Wood-pewee taking current human footprint into account.
Land managers, however, are often more interested in evaluating alternative management options by comparing scenarios. These scenarios involve the description of how land cover is expected to change in space and time. Therefore, spatially explicit predictions are needed to understand how the management scenarios impact populations over time. The software tool mentioned above can be used to make such spatial predictions based on land cover and location as inputs. The tool is in active development and we are collaborating with government and industry partners to evaluate bird responses to land use decisions.
These “made in Alberta” bird models are useful for resource management within the province, serve as templates for developing similar models and results in other Canadian provinces and territories, and also serve continental scale bird conservation. Does this mean that by having these great models there is no need for additional data collection? Of course not. Having a large dataset to work with is a privilege that comes as a result of the hard work of thousands of people and decades of investment in field sampling. Continuing the work—as we intend to do—will reveal finer differences related to management practices and human footprint types and will also let us look at changes over time. Stay tuned!
This post was written by ABMI senior statistical ecologist Péter Sólymos. Péter can be reached at solymos@ualberta.ca.