The following blog comes to us courtesy of Sydney Toni, summarizing a recent paper in Ecological Solutions and Evidence.
Ideally, the information we collect to manage wildlife habitat is many things: high-resolution, consistent, and covering all areas of interest. The gold standard of habitat assessment, ground-based surveys, provides high-quality data at particular locations but can’t cover a wide area and can lack consistency. The increasing availability of high-resolution remote sensing data creates exciting prospects for tracking the state of wildlife habitat at large scales.
In the case of woodland caribou, an endangered species in the boreal forest of Canada, there is an urgent need for detailed information on vegetation, in particular on vegetation regrowth (or lack thereof) on disturbances, across entire caribou ranges. Decision makers need this information to understand the state of caribou habitat and decide where to prioritize restoration efforts. In northern Alberta, there are hundreds of thousands of kilometres of “linear features” stemming from energy exploration and extraction: roads, seismic lines, and pipelines that criss-cross and fragment habitat. The restoration of linear features is a management focus, as these features contribute not only to habitat loss and fragmentation but also act as travel corridors for predators.
There are three key pieces of information in understanding vegetation recovery in caribou habitat: height, density, and type of vegetation (i.e., is it coniferous, is it shrubby). Vegetation above a certain height can slow predator use of corridors; shrubby or deciduous regeneration can provide food for moose and white-tailed deer, whose populations in turn sustain higher predator populations. A recent paper demonstrated a method that combines high-resolution aerial imagery (i.e., photos taken from a plane with a resolution of 15 cm) with Light Detection and Ranging (LiDAR; i.e., airborne lasers) to assess vegetation metrics such as these efficiently and consistently across more than 1,800 km2.
The use of high-resolution remote sensing is not new in forest inventories, but our paper highlights a new application and one that does not require high-resolution LiDAR data, which can be cost-prohibitive. The first dataset, high-resolution aerial imagery, enabled us to build a “point cloud” that provides estimates of tree-top locations (see the Figure for an example). The second, low-resolution LiDAR, provides an estimate of the earth’s surface; we then combined this information to estimate the height and density of trees. In areas where the point clouds were visually obstructed (e.g., on narrow linear features overshadowed by adjacent canopy), we went in and manually interpreted vegetation through stereoscopy (i.e., created a three-dimensional landscape by overlapping the aerial imagery and assessing the vegetation while wearing 3D glasses).
Results from our pilot area highlight how tools such as this can help identify where restoration is needed most across wide areas and where regeneration is naturally occurring. For instance, we found that seismic lines had limited vegetation, even though many of these features were created decades ago; the majority had vegetation below 1.5 m in height, which is also below the threshold found to slow wolf speeds even marginally when travelling along these features.
Limited information in turn limits decision making power. Here, we demonstrate a semi-automated method to efficiently and cost effectively develop a high-resolution snapshot of vegetation recovery on disturbances, enabling managers to focus on areas where the greatest restoration needs lie and assess changes in vegetation or quantify restoration success over time through repeated remote measurements.
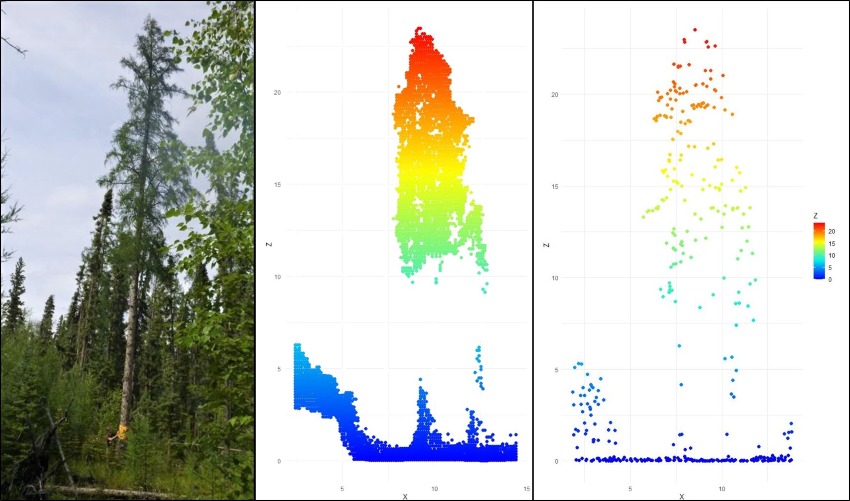
Example of a point cloud that can be used to estimate tree height and density.