The ABMI recently released a new report on the status of human footprint in Alberta. Depending on your particular interests, you were probably struck by different aspects of the report—maybe the fact that 78% of central Alberta is now under human footprint, or the fact that in the Athabasca Oil Sands Area, that number is only 8.4%. There’s a lot to take in, and we’d like to highlight some more of what we find especially interesting, and sometimes challenging, about the status of human footprint in Alberta.
First, why should we measure human footprint at all? Human footprint refers to areas of the land base that have been altered through human activities—places where natural ecosystems have been replaced by something else through our actions. In other words, the extent, distribution, and characteristics of human footprint illustrate how human activities have changed the landscape. If human footprint information is re-assessed and updated regularly, change over time can reveal land-use trends and give insight into their likely future trajectories. The ABMI operates on the belief that you manage what you measure, and this footprint information is exactly what is needed to help land-use decision makers make informed, science-based choices that will serve Alberta well for years to come.
So what does the information tell us? Well, as of 2015, 29.2% of Alberta is under human footprint, up from 25.7% in 1999—that’s an average increase of about 0.22%, or around 1450 km2 (560 sections) per year. Of course, human footprint isn’t spread evenly around the province, or among footprint types.
This brings up a second point, that Alberta is a complex mosaic of both ecosystems and land-uses. To understand these complexities, it is convenient to think of human footprint patterns broken down by Natural Region and footprint type, as we’ve done in the ABMI report. Parsing the information this way makes it easier to relate numbers to actual places and activities, and to tell a compelling story of the sort that grabs headlines. But it’s also important to remember that none these categories exist in a vacuum. It’s possible—and unfortunately common—to cherry-pick regions or footprint types that paint especially flattering, or damning, pictures of land-use in the province.
Cover of the ABMI’s preliminary report on the status of human footprint in Alberta.
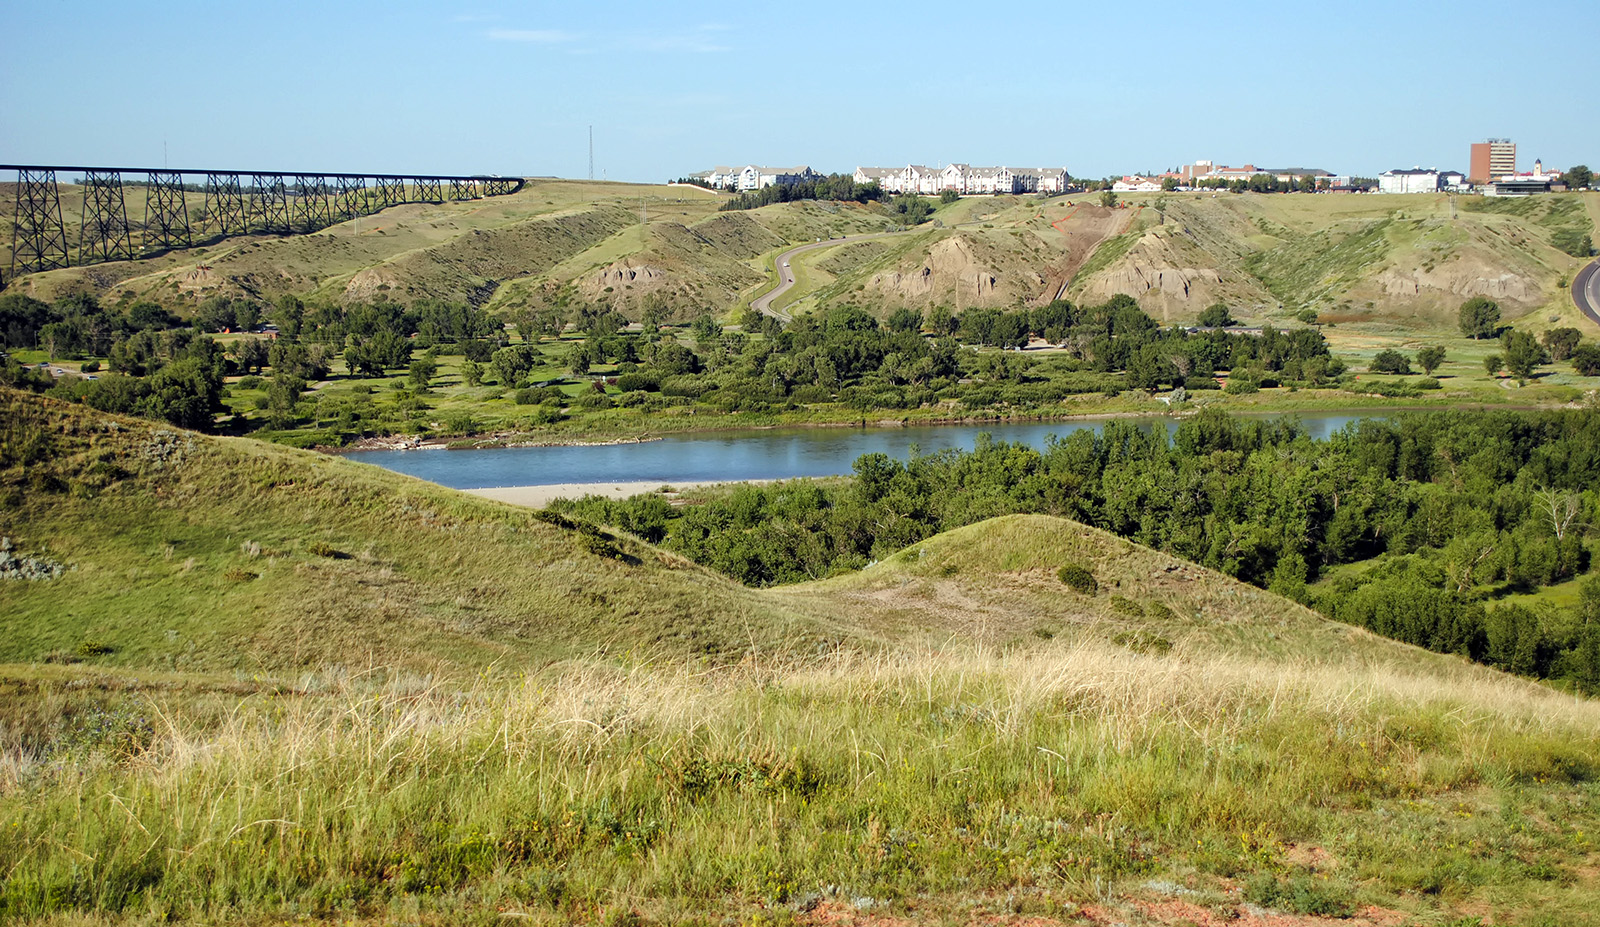
Take the Parkland Natural Region in central Alberta, home to much of Alberta’s population and agricultural development—as noted, 78% of this region is already under human footprint. Or the Grassland Natural Region, 57% of which is currently under human footprint. Those are big numbers, and they’re still growing, with both regions seeing an additional 0.14% or so converted each year on average, mostly by agricultural, urban, transportation, and industrial footprints.
Or take a closer look at forestry. Forestry footprint covers around 20% of the Foothills Natural Region and less than 3.5% of the Boreal Natural Region. But in both cases, the amount has nearly doubled since 1999 (average increases of around 0.64% and 0.11% per year, respectively).
Now let’s look at the same Natural Regions and footprint types from a different perspective. In the Grassland Natural Region alone, around 3100 km2 of land that was cultivated prior to 1950 has since reverted to semi-native conditions. Or consider that forest harvest areas are replanted, and generally recover toward near-native conditions over the next 60–80 years (recovery times differ somewhat for different forest types, and the question of whether 100% complete recovery is possible remains a topic of debate). On average, existing harvest areas in both the Boreal and Foothills regions have recovered by around 20%, and the process is ongoing. Accurately accounting for this recovery is a major focus of the ABMI’s continuing research to deliver the best possible biodiversity data for Albertans.
As you can see, the story of land use in Alberta is complex, and there are many ways to frame what is found. But the nice thing about detailed, border-to-border data is that it can help break down some of these ‘information silos’ by revealing the full complexity of what is happening in our province. Ultimately, numbers are just numbers, and human footprint information is just a tool—a very useful one—for understanding the ecological effects of human activity. As with any tool, it exists to be used, but it can be used as a blunt instrument, or with skill and nuance, or not at all. That is up to the user.
Which brings us to the third and final point. Producing a complete, border-to-border inventory of human footprint for a region as large as Alberta is difficult, and the means to do so—the fine-scale aerial imagery and the computing power needed to process it—haven’t been around for long. Likewise, organizations like the ABMI, and its partnership under the Alberta Human Footprint Monitoring Program, are rare. The fact is, integrated, province-wide human footprint information of the kind detailed in the ABMI’s new report is a first for Canada.
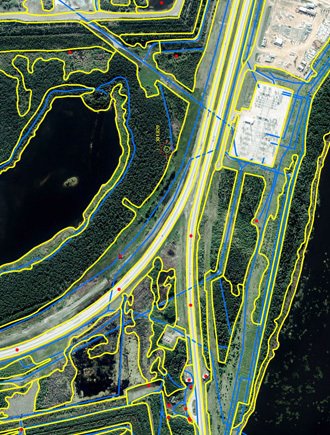
Identifying, outlining, and classifying human footprint is a labour-intensive process.
More than any particular number from any particular region or footprint type in Alberta, we think this is an important story to tell: that Alberta’s land-use is unique, but so is its capacity to understand, plan for the future, and act. Have a look at the human footprint report and see for yourself. You’ll find numbers that will surprise you—some in a good way, others not so much. Good or bad, you can only peruse this kind of detailed information for Alberta.
So Alberta is the only province with this tool in its land management toolbox. The question is, will it be used to its full potential? At the ABMI, we certainly hope so, and we’re happy to play a role in providing the best possible information—the best possible tools—to Alberta’s land managers. After all, you manage what you measure.